Labour markets in the green economy
People living in the EBRD regions tend to be aware of climate change and its consequences. However, that does not necessarily translate into a willingness to pay higher taxes or forgo economic growth and job creation in order to prioritise environmental policies. Economic history emphasises the importance of labour market adjustments during major economic transformations, offering insights for the transition to a green economy. Despite increasing demand for green skills, labour market adaptation remains sluggish across the EBRD regions, partly reflecting the slow pace of green innovation. In order to maintain public backing for climate action, it is vital to ensure a just transition process and address the economic concerns of vulnerable groups.
Introduction
Public support for environmental policies depends not only on their ecological benefits, but also on their perceived economic implications. This chapter documents people’s attitudes towards climate change across the EBRD regions and provides in-depth analysis of what the transition to a green economy means for labour markets.
Overall, people living in the EBRD regions recognise that climate change is real and has serious consequences. However, those beliefs do not necessarily translate into a willingness to pay higher taxes or forgo economic growth and job creation in order to prioritise environmental policies. Unwillingness to support green policies tends to be greater among the socio-economic groups that are most vulnerable to such changes, including those in the bottom half of the income distribution and the less educated. It is essential that the green transition – the transition to a less carbon-intensive economy – is fair and benefits most members of society, in order to maintain public support for achieving net-zero greenhouse gas emissions.
Major economic transitions of the past, such as the roll-out of digital technologies, the globalisation of trade and investment, and the phasing-out of coal, have three main implications for the green transition.1 First, such transitions entail a reallocation of employment across sectors and industries, as well as a transformation of job requirements. Second, they create substantial opportunities and benefits for workers, accompanied by new risks. And third, their impact varies across geographical areas and demographic groups, which can potentially exacerbate existing disparities.
The green transition cannot take place without an adequately skilled workforce that is able to satisfy the demands of a greener economy. New types of job will emerge as households and producers adopt greener technologies. Demand for workers with green skills is already on the rise, and this chapter documents a wage premium of 4 per cent for such workers. However, that green premium accrues disproportionately to highly skilled workers and less to individuals who are more likely to be climate sceptics.
When faced with technological change, businesses often look to replace workers with machines as they adopt new technologies, a phenomenon known as “labour substitution”. This chapter finds that green innovation generally involves less labour substitution than other types of innovation, but that this is not necessarily the case in the EBRD regions.
Despite the wage premium that green jobs command, workers’ ability to move from “brown” (in other words, polluting) industries to greener sectors remains limited, partly reflecting the inelastic supply of newly required skills in the short term. At the same time, green policies affect different areas and different labour market segments in different ways, potentially upending local labour markets. For instance, the loss of existing jobs in sectors that are associated with the highest emissions (such as the extraction of fossil fuels) is likely to be concentrated in specific regions.
With that in mind, policymakers need to combine localised short-term income support with sector specific long-term workforce development to facilitate labour market adjustments. Labour market programmes that focus on retraining and upskilling can help to ensure that the transition to a greener economy is fair and enjoys broad support, as can regional development initiatives.
Attitudes towards the green economy
With a few exceptions, countries around the world have committed to achieving the climate goals set out in the Paris Agreement. For those goals to be achievable, they must enjoy broad support among citizens. This section uses data from the most recent wave of the Life in Transition Survey (LiTS IV), conducted in 2022 and 2023 by the EBRD and the World Bank, to explore people’s attitudes towards climate policies and map out the level of support for green action at present. As part of that survey, respondents were asked about their beliefs regarding climate change and its consequences. Participants were also asked whether they would prioritise the environment at the expense of economic growth and jobs, and whether they would be willing to pay higher taxes in order to fund policies that addressed climate change and its effects.
In most of the economies surveyed, a large percentage of respondents either agree or strongly agree that climate change is real and are concerned about its consequences (see Chart 3.1). All in all, 63 per cent of surveyed individuals believe that “climate change is real”, with 75 per cent of them believing that “climate change will seriously affect the children of today”. Although figures vary across economies, roughly two-thirds of the people surveyed are concerned about air pollution, the loss of biodiversity, natural disasters and extreme weather, rising temperatures, the spread of disease and environmental pollution. Around half of all respondents are also concerned about a lack of action on climate change.
Although there is broad recognition that the consequences of climate change are severe, willingness to bear the economic cost of the green transition is significantly lower across much of the EBRD regions. For instance, only 43 per cent of surveyed individuals would prioritise the environment at the expense of economic growth and jobs, while between 37 and 43 per cent would pay more tax in order to fight global warming, prevent biodiversity loss or reduce/prevent pollution. In order to take a more detailed look at the tension between people’s beliefs about the environment and their willingness to pay for green policies, an unsupervised machine learning algorithm called “k-means clustering” can be used to identify groups of individuals with similar attitudes towards climate change and environmental issues. This cluster analysis reveals three distinct groups of respondents (see Chart 3.2).
The first group, “supporters” (accounting for 46 per cent of respondents), are concerned about climate change and are largely willing to pay for climate-related policies. The second group, “sceptics” (accounting for 25 per cent of respondents), are less convinced that climate change is a threat and are largely unwilling to pay climate-related taxes. The remaining 29 per cent of respondents are classified as “disengaged” (a group that can be regarded as inconsistent in the sense that 79 per cent of them agree that climate change will seriously affect them during their lifetime, but just 1 per cent are willing to pay more tax in order to fight global warming).
Numbers of disengaged individuals – those who are concerned about the environment, but unwilling to pay for climate policies – are highest in Morocco, Greece, North Macedonia and Jordan, where they account for between 38 and 45 per cent of total respondents (see Chart 3.3).
Regression analysis can then be used to estimate the likelihood of an individual belonging to one of those three groups given their sector of employment, occupation, level of education, income, country of residence and other characteristics. Chart 3.4 shows standardised estimates based on this analysis.
Environmental policies are more likely to be supported by people with a university education, those in the top quartile of the income distribution in their country, and those who prefer a democratic system and a market economy. Personal exposure to natural disasters is also associated with a greater likelihood of supporting climate policies. Climate scepticism is more likely to be found among men, individuals with no past exposure to a natural disaster, those with negative attitudes towards market economics or democracy, and those who attach more weight to present consumption than future consumption (with this “present bias” being inferred from survey questions asking whether an individual would prefer to receive (i) a guaranteed payment of a specific size today or (ii) a much larger guaranteed payment in a month’s time).
People are more likely to be disengaged if they are less educated, are in the bottom half of the income distribution, are female, have personally experienced natural disasters and prefer market economics and democracy. Lower levels of income and education tend to distinguish this group from supporters, while personal experience of natural disasters and greater support for democracy tend to distinguish this group from sceptics.
Chart 3.1
Source: LiTS IV and authors’ calculations.
Note: This chart shows the percentages of survey respondents who “agree” or “strongly agree” with each statement.
Chart 3.2
Source: LiTS IV and authors’ calculations.
Note: This chart shows the percentages of respondents within each group who “agree” or “strongly agree” with each statement, with those groups being identified using a k-means algorithm. The three groups – “supporters”, “sceptics” and “disengaged” – are mutually exclusive clusters of individuals across the EBRD regions who have been grouped together on the basis of their responses to a set of questions about their beliefs, concerns and willingness to act on climate change.
Chart 3.3
Source: LiTS IV and authors’ calculations.
Note: This chart shows the percentages of respondents in each country who fall into the three groups, with those groups being identified using a k-means algorithm. The three groups are mutually exclusive clusters of individuals who have been grouped together on the basis of their responses to a set of questions about their beliefs, concerns and willingness to act on climate change.
Chart 3.4
Source: LiTS IV and authors’ calculations.
Note: This chart shows the coefficients that are derived by regressing an individual’s probability of being in a particular group on the personal characteristics listed on the horizontal axis. Each regression includes industry, occupation and country fixed effects. The 95 per cent confidence intervals shown are based on standard errors clustered at the country level.
Demand for skills and labour mobility
As consumers’ preferences shift and producers switch to cleaner production methods, there will be a significant increase in demand for green jobs throughout the economy, from the use of environmentally friendly materials in construction and manufacturing to a focus on sustainability in supply chain management and urban planning. At the same time, organisations providing financial and other services will be seeking individuals who can navigate the complexities of environmental regulations, carbon markets and sustainable investment. These various jobs will require new skill-sets that many existing workers do not yet possess.
Defining “green” jobs
There is no universally accepted definition of what constitutes a “green” occupation or economic activity. While there are various different approaches that can be adopted, they typically fall into one of two main categories.
Top-down approaches classify jobs as green if they are in industries with low levels of emission intensity (in the bottom 20 per cent across all sectors, for instance). All jobs in the sector in question – renewable energy, for example – are considered green, regardless of the specific occupation or the level of skill content. Likewise, sectors can be classified as “brown” if they have high emissions per unit of value added.
In contrast, bottom-up approaches define green jobs on the basis of the skills or tasks involved, irrespective of the sectors that the jobs are in.2 Every occupation is characterised by a mixture of tasks, with those related to the reduction of carbon emissions or improvements in environmental sustainability typically being classified as green. With this kind of approach, a solar energy engineer (a high-skill occupation) and a refuse truck driver (a low-skill occupation) will both be classified as green. These two types of approach complement each other.
In order to construct measures of the greenness of occupations, this section follows in the footsteps of recent literature by taking information on the task content of occupations from the US Department of Labor’s O*NET database. First, the occupations reported by LiTS participants, which were provided as free-text answers, are matched to three-digit ISCO occupation codes. Then, each occupation is matched to the relevant eight-digit classification in O*NET, classifying it as green or non-green using an existing crosswalk.3 Green occupations include physical and earth science professionals, recycling plant technicians and installers of electrical equipment, for example.
Overall, around 27 per cent of LiTS respondents who are in work have green occupations on the basis of this classification. Similar percentages can be observed across the various economies participating in the survey.
Wage premium for green jobs
The transition to a green economy promises to introduce new high-skill and high-paying jobs, but it could also create low-wage or temporary positions in recycling, waste management or parts of the green manufacturing sector.
On average, workers with green jobs earn 17 per cent more than workers in other occupations (see Chart 3.5), with this wage differential being broadly consistent across the EBRD regions. However, those raw premia do not take account of other determinants of labour income, such as a worker’s qualifications and experience. Regression analysis can be used to check whether wages differ systematically between green jobs and other jobs, while controlling for an individual’s sector of employment, country of residence and other characteristics.
When factors such as gender, age, education, skill level, years of work experience, hours worked, and sector and country of employment are considered, green jobs continue to command a wage premium, but at a much lower level of 4 per cent (see Chart 3.5). The difference between the raw premium and the adjusted premium suggests that, to a substantial extent, workers are sorted into green occupations on the basis of observable characteristics. The adjusted premium is larger for high skilled workers (at 5 per cent) than it is for low-skilled workers, while moderately skilled workers do not enjoy a green wage premium.
The green wage premium suggests that demand for green skills in the market exceeds the supply of workers with the requisite skills. The next section looks at demand for green skills across occupations, leveraging data from LinkedIn through the Development Data Partnership.
Chart 3.5
Source: LiTS IV and authors’ calculations.
Note: This chart shows the estimates that are derived from regressing the logarithm of monthly income on a dummy variable indicating whether an individual has a green job, while controlling for the individual’s gender, age (and age squared), level of education, skill level, years of work experience, hours worked, and sector and country fixed effects. The raw premium is the difference between mean wages.
Demand for green skills
The analysis in this section draws on the online activity of more than 200 million LinkedIn members across a number of economies in the EBRD regions where LinkedIn Economic Graph data are sufficiently representative of job vacancies, job to job transitions and job seekers’ skills – plus France, Germany, Italy, the United Kingdom and the United States of America as comparators. Previous studies have shown that LinkedIn Economic Graph data do a good job of capturing an industry’s employment share and employment growth; however, it is also worth noting that LinkedIn’s coverage is skewed towards younger cohorts, women and individuals with a tertiary education.4
In the LinkedIn data, green jobs are defined as occupations that usually involve one or more green projects or are closely associated with green skills. In order to be defined as green, a project must include at least one green activity, such as pollution or waste prevention, energy management, generation of renewable energy, ecosystem management, sustainability education and research, environmental policy, sustainable procurement or environmental finance.5 Green skills, in turn, capture the top skills of LinkedIn members whose work predominantly involves one or more green projects (as listed in those members’ profiles).
Across the EBRD regions as a whole, green jobs accounted for 14 per cent of total paid job postings at the beginning of 2023, up from just under 9 per cent in 2018 (see Chart 3.6). In the advanced comparator economies, this ratio – a measure of demand for green skills – increased more rapidly, rising from 10 to 21 per cent on average over the same period.
The fact that the EBRD regions have lower green jobs ratios than advanced economies may reflect the slower pace of their transition to net zero, as well as an insufficient supply of qualified individuals with green skills. According to LinkedIn data, the percentage of members in the EBRD regions who had a green occupation or listed green skills in their online profile stood at around 10 per cent in April 2023, below the average for the advanced economy comparators (see Chart 3.7). Within individual countries, the accumulation of green skills has accelerated somewhat over the past year, but it does not, overall, appear to have kept pace with the rise in demand.
In every economy, women are less likely to have a green occupation or list green skills in their online profile than men (see Chart 3.8). This may reflect the fact that women are under-represented in STEM jobs, which are particularly common in sectors such as renewable energy. Employment in the renewable energy sector is already estimated to account for half of total energy-related employment worldwide, and it is expected to grow rapidly as the transition to net zero accelerates.6 Thus, the emerging green economy gender gap has the potential to further widen the gender pay gap as the green transition progresses.
These results corroborate broader evidence for the OECD economies, where women are estimated to account for just 28 per cent of all jobs with green tasks.7 The green economy gender gap is typically smaller in the EBRD regions than it is in advanced economies; however, that gap has widened since 2015.
Policy measures with the potential to arrest and reverse that trend include support for girls’ engagement with STEM subjects in schools and career guidance after university. It should also be noted that while men are more likely to have green skills, as captured by LinkedIn data, they are also more likely to be employed in sectors that are home to disappearing brown jobs (that is to say, the sectors that may well end up bearing the brunt of job losses).8
Chart 3.6
Source: LinkedIn (via the Development Data Partnership) and authors’ calculations.
Note: The pale lines indicate the ratios for individual economies. The figures for the EBRD regions cover Croatia, the Czech Republic, Estonia, Greece, Latvia, Lithuania, Poland, Romania, the Slovak Republic and Türkiye. The comparator countries are France, Germany, Italy, the United Kingdom and the United States.
Chart 3.7
Source: LinkedIn (via the Development Data Partnership) and authors’ calculations.
Note: Green jobs are either (i) in a green occupation or (ii) associated with green skills. The grey lines denote the comparator countries France, Germany, Italy, the United Kingdom and the United States.
Chart 3.8
Source: LinkedIn (via the Development Data Partnership) and authors’ calculations.
Note: LinkedIn members are considered to have green skills if (i) they explicitly list green skills in their profile or (ii) they have a green occupation.
Mobility across jobs
As societies and economies adopt more energy-efficient practices and green policies take effect, individuals working in carbon-intensive industries will experience dramatic changes to their jobs. While some industries will be able to transition to cleaner methods of production while maintaining their existing employment levels, others are likely to see jobs disappear. Such job losses may inflict particular pain on those regions that are most reliant on high-emission industries (see Box 3.1). Helping workers to move out of emission-intensive sectors and into other parts of the economy will therefore be an essential component of a just green transition.
Despite a substantial green wage premium in green sectors, mobility from brown to green sectors has been limited in the EBRD regions, as the analysis in this section shows. Green industries are defined as (i) those that support – directly or indirectly – the generation of renewable energy (for instance, solar, wind and hydroelectric power, or the manufacturing of PV cells), (ii) those with no direct carbon emissions (such as nuclear power), and (iii) those that administer environmental programmes and services. Brown industries are those that produce or support fossil fuels (including coal mining, oil extraction, and the use of fossil fuels to generate electrical power). Data on job-to-job transitions for LinkedIn members are used to document the net flow of workers into green and brown activities, which are classified on the basis of a top-down approach.
LinkedIn data indicate that there was a net flow of workers into green activities between 2015 and 2023 across all economies (that is to say, more workers moved into green industries than moved out of them; see Chart 3.9). Average net rates of transition into green activities were similar across the EBRD regions and advanced comparators, with the highest net transition rate being observed in Estonia. However, a net flow into polluting industries was also observed in the EBRD regions over that period. Thus, more workers found new employment in brown industries than left those industries. In advanced comparators, by contrast, more workers moved out of brown industries than moved into them (that is to say, there was a net outflow).
On average, only around 1 in 20 workers leaving a job in a brown industry immediately find employment in a green industry (see Chart 3.10). This transition rate is almost 1 in 10 in Slovenia, but as low as 1 in 50 in Croatia.
Alternatively, industries can be classified as green or brown on the basis of their average greenhouse gas emissions per unit of value added.9 On that basis, wholesale and retail trade, public administration and various other services can be classified as green, while brown industries mainly comprise manufacturing sectors. Individual-level data from EU Labour Force Surveys can be used to track workers who move out of brown industries, looking to see whether, one year later, they are (i) employed in a green industry, (ii) employed in a non-green industry, (iii) retired, (iv) unemployed or (v) in training.
Over the period 1998-2019, an average of 16 per cent of all workers in the EBRD regions who moved out of brown sector jobs found employment in a green sector within a year (see Chart 3.11). Almost half of all workers who moved out of a brown sector were unemployed a year later, 19 per cent had retired, and only 2 per cent were undergoing retraining or upskilling.
Mobility out of brown industries and into green industries was lower in the EBRD regions than in advanced European economies. In that group of comparator economies, 26 per cent of workers leaving brown-sector jobs found employment in a green sector within a year. Around one in three workers were unemployed a year after leaving their brown-sector job, 14 per cent had retired and 5 per cent were undergoing retraining or upskilling.
Chart 3.9
Source: LinkedIn (via the Development Data Partnership) and authors’ calculations.
Note: The vertical axis measures the number of workers moving out of a brown sector divided by the number moving into such a sector (so figures in excess of 1.0 denote a net outflow). The horizontal axis indicates the number of workers moving into a green sector divided by the number moving out of such a sector (so figures in excess of 1.0 denote a net inflow). All data relate to the period 2015-23. Brown industries are those that produce or support fossil fuels (including coal mining, oil extraction, and the use of fossil fuels to generate electrical power). Green industries are defined as (i) those that support – directly or indirectly – the generation of renewable energy, (ii) those with no direct carbon emissions, and (iii) those that administer environmental programmes and services.
Chart 3.10
Source: LinkedIn (via the Development Data Partnership) and authors’ calculations.
Note: Brown industries are those that produce or support fossil fuels (including coal mining, oil extraction, and the use of fossil fuels to generate electrical power). Green industries are defined as (i) those that support – directly or indirectly – the generation of renewable energy, (ii) those with no direct carbon emissions, and (iii) those that administer environmental programmes and services.
Chart 3.11
Source: EU Labour Force Survey micro data (1998-2019), World Input-Output Database (WIOD) environmental accounts (2016) and authors’ calculations.
Note: Brown and green sectors are defined on the basis of their emission intensity. Employment status is captured one year after the worker has left a brown-sector job.
Green innovation and labour markets
The move towards a greener economy has been facilitated by rapid digitalisation. For instance, smart technologies and data analytics have increasingly been integrated into energy management, waste reduction and resource optimisation. Those innovations have created demand for workers with a combination of environmental knowledge and digital literacy. This section looks, more broadly, at how the development of green technologies affects local labour markets. It does so by drawing on individual-level data from the EU Labour Force Surveys covering Bulgaria, the Czech Republic, Estonia, Greece, Hungary, Latvia, Lithuania, Poland, the Slovak Republic and Slovenia, as well as Germany, Italy, Spain and the United Kingdom.
Those labour force survey data are combined with information on patents filed with the US Patent and Trademark Office (USPTO) over the period 1996-2019 (which includes the title of each patent and a description of the purpose of the new technology and possible use cases). New green technologies are identified using the Y02 tagging scheme employed by the European Patent Office (EPO), which provides the most comprehensive and widely used classification of low-carbon technologies.10 That scheme covers both mitigation and adaptation across a wide range of areas.
For computational convenience, the USPTO database was queried to retrieve all patents classified as green (418,199 in total) and a random sample of 20 per cent of all non-green patents per year. The largest category of green patents (comprising nearly 140,000 patents) relates to the reduction of greenhouse gas emissions and the generation, transmission or distribution of energy, with the next largest categories relating to mitigation technologies in respect of (i) transport, (ii) the production or processing of goods, (iii) ICT aimed at reducing one’s own energy use and (iv) buildings.
The number of green patents filed per year increased from around 6,000 in 1996 to nearly 30,000 in 2017 as green innovation took off (see Chart 3.12). However, it continues to account for a relatively small share of overall innovation (just 7.7 per cent in 2019) owing to rapid increases in the numbers of patents filed in other fields, such as artificial intelligence. (The drop in patenting activity that can be seen post-2017 in Chart 3.12 is simply an artefact of the data, as patent applications are published with a significant lag.)
In terms of the geography of innovation, lead inventors located in Germany, Japan and the United States account for more than half of all green patents (whereby the first inventor listed on the patent is assumed to be the leader). In contrast, most middle-income economies continue to make a negligible contribution.11 Only 0.3 per cent of all green patents included in this analysis had a lead inventor located in the EBRD regions (with a similar share being observed for non-green patents), with the Czech Republic, Hungary and Poland being home to the most lead innovators for green patents (see Chart 3.13).
Chart 3.12
Source: USPTO and authors’ calculations.
Note: Green patents are identified using the EPO’s Y02 tagging scheme.
Chart 3.13
Source: USPTO and authors’ calculations.
Note: Green patents are identified using the EPO’s Y02 tagging scheme.
Exposure to green technologies
Although advances in the area of green technology are a global trend, their impact on labour markets is inherently local, being driven by the jobs and skills that are available in a local labour market when a new green technology arrives. In order to evaluate that impact, this section develops a novel measure of exposure to green (Y02) technologies compared with non-green technologies for each occupation at the three-digit level of the ISCO classification.12 Specifically, it uses natural language processing to measure the textual similarity of (i) descriptions of the tasks performed by workers in a given occupation (based on O*NET data) and (ii) descriptions of innovation in patent documents. If the estimated similarity falls within the top 25 per cent of all similarity scores, the patent in question is mapped to an occupation. For example, a patent for a “remote controlled circuit breaker panel system” which “has been developed to provide a remote central control point for individual circuits, and […] for retrofitting it to existing service panels or installing it in new service panels” is matched to “electrical equipment installers and repairers” who “install, fit and maintain electrical wiring systems and related equipment, electrical machinery and other electrical apparatus”. For each occupation, the ratio of mapped green patents to total mapped patents tracks the relative exposure of that occupation to green innovation.
This measure shows that some occupations are more exposed to green innovation than others. For instance, installers and repairers of electrical equipment are highly exposed to green innovation, given the high levels of patenting activity in respect of the generation of renewable energy, power storage, electric vehicles and energy-efficient construction. Other occupations with large numbers of green patents as a percentage of all relevant patents include machinery mechanics and repairers, and mining and construction labourers. Workers with such occupations are more likely to be affected by the adoption of green technologies. Micro data from the EU Labour Force Survey can be used to calculate the likelihood of various groups (broken down by gender or place of residence, for instance) being employed in exposed sectors.
On average, men tend to have occupations that are more exposed to green innovation (see Chart 3.14, which shows green patents as a percentage of total innovation relevant to men and women, based on the sectors where they tend to be employed). The gender gap of 1.5 percentage points in 2019 is sizeable relative to the average exposure to green innovation across occupations in that year (8.5 per cent). On the one hand, this implies that if green innovation increases demand for labour and wages, men stand to benefit more than women, at least in the short term. On the other hand, however, it also implies that if new green technologies replace labour, men will be more likely to lose their jobs.
This analysis also reveals that workers with low levels of education are more likely to have occupations with greater exposure to green innovation (see Chart 3.15). This may entail job displacement among lower-skilled workers13 or create opportunities for them. For instance, innovation in the areas of recycling, power generation and grid maintenance is likely to increase demand for occupations that predominantly employ medium or low-skilled workers. Similarly, in construction, the need for energy-efficient buildings could, for instance, increase demand for installers of heat pump boilers, carpenters and joiners, bricklayers, and technicians.14 There are no meaningful differences between urban and rural workers or between different age groups in terms of exposure to green innovation.
Chart 3.14
Source: USPTO, EPO, EU Labour Force Survey and authors’ calculations.
Note: Shares are first calculated by occupation and averaged using gender-specific weights based on occupation patterns. The sample comprises Bulgaria, the Czech Republic, Estonia, Greece, Hungary, Latvia, Lithuania, Poland, the Slovak Republic and Slovenia in the EBRD regions, plus Germany, Italy, Spain and the United Kingdom as comparators.
Chart 3.15
Source: USPTO, EPO, EU Labour Force Survey and authors’ calculations.
Note: Shares are first calculated by occupation and averaged using education-specific weights based on occupational patterns. The sample comprises Bulgaria, the Czech Republic, Estonia, Greece, Hungary, Latvia, Lithuania, Poland, the Slovak Republic and Slovenia in the EBRD regions, plus Germany, Italy, Spain and the United Kingdom as comparators.
Occupational exposure and employment growth
The arrival of new green technologies may create or destroy jobs. Over the last few decades, technological change in advanced economies has typically been found to be labour-substituting, with a specific bias against routine tasks, which are predominantly found in medium-skill jobs (those of typists, bank tellers, payroll clerks or supermarket cashiers, for example).15 However, innovation also has the potential to be labour-augmenting, complementing the tasks performed by workers and increasing demand for labour. For instance, technological progress in the area of clean construction methods can benefit architects and designers who specialise in creating energy-efficient, environmentally friendly buildings and structures. Similarly, demand for installers of solar photovoltaic (PV) cells or specialists in carbon capture and storage may also increase. The regression analysis that follows seeks to establish which of these effects dominates when it comes to exposure to green innovation.
In particular, the analysis links local employment growth in a given occupation to the measure of exposure to green innovation and various local labour market characteristics, as well as region-period fixed effects. Employment growth is measured as the change in the logarithm of average employment for a three-digit ISCO occupation in a NUTS-2 subnational region between the four-year periods in question (2000-03, 2004-07, 2008-11, 2012-15 and 2016-19). Occupational exposure to green and non-green innovation is lagged by one period.
The results show that an occupation’s overall exposure to technological innovation tends, on average, to be labour-substituting, in line with previous findings.16 A 1 standard deviation increase in an occupation’s exposure to non-green patents in one period is associated with an 8.9 per cent decline in the number of workers with that occupation in the region in question in the next period (see Table 3.1).
This labour-substituting effect is more muted where exposure to green innovation is greater. Conditional on an occupation’s overall exposure to innovation and controlling for local employment trends, a 1 percentage point increase in green patents’ share of an occupation’s total exposure to innovation in one period is associated with a 3.9 per cent increase in employment for that occupation in the next period. This is a large impact in economic terms, as green patents account for 6.8 per cent of all relevant patents for the average occupation. However, this effect is larger in advanced economies, which are responsible for most green patents. In the EBRD regions, the positive correlation between green patents’ share of total exposure and employment is much smaller and not estimated with statistical precision.
Table 3.1
|
(1) |
(2) |
(3) |
(4) |
(5) |
(6) |
|
All economies |
EBRD regions |
Comparators |
| Total number of relevant patents (standardised) |
-8.930* |
-8.624* |
-9.719* |
-9.637* |
-8.775* |
-8.436* |
| (5.009) |
(4.901) |
(5.072) |
(5.098) |
(5.198) |
(5.040) |
| Green patents as a percentage of relevant patents |
|
3.935* |
|
0.907 |
|
4.494* |
|
(2.233) |
|
(2.151) |
|
(2.341) |
| Region-period fixed effects |
Yes |
Yes |
Yes |
Yes |
Yes |
Yes |
| Observations |
35,899 |
35,899 |
12,842 |
12,842 |
23,057 |
23,057 |
| Adjusted R2 |
0.881 |
0.882 |
0.667 |
0.667 |
0.892 |
0.893 |
Source: USPTO, EPO, EU Labour Force Survey and authors’ calculations.
Note: The dependent variable is 100 x the change in the logarithm of average employment for a given occupation, NUTS-2 region and four-year period. Each regression includes region-period fixed effects. Standard errors are clustered at occupation level, and occupation-region-period observations are weighted by their relative size in the previous period. * indicates statistical significance at the 10 per cent level. The sample comprises Bulgaria, the Czech Republic, Estonia, Greece, Hungary, Latvia, Lithuania, Poland, the Slovak Republic and Slovenia in the EBRD regions, plus Germany, Italy, Spain and the United Kingdom as comparators.
Fast and slow green transitions
In addition to changes to the occupational structure of employment, green innovation is transforming the skill-sets demanded by a wide range of existing professions. For instance, while demand for architects or urban planners may not be directly affected, urban planning and architecture are increasingly incorporating principles of eco-design and green infrastructure, requiring skills and knowledge relating to sustainable construction techniques and energy-efficient building practices.
How quickly the demand for these new skills is met in the labour market will, to a large extent, determine the speed at which countries can roll out green technologies. Experience gained from globalisation, automation and the ICT transition suggests that labour does not chase capital (that is to say, workers are not sufficiently mobile), and neither does capital chase labour (that is to say, firms are not sufficiently attracted to areas with lower wages).17 Instead, labour shortages and skills mismatches have the potential to persist as local markets slowly adjust. For instance, in a recent survey of local municipalities across Europe, 69 per cent reported that their lack of environmental and climate assessment skills was a barrier to climate investment.18
The role of skill specificity
Sometimes, innovations benefit occupations which require skills that are rather different from those used by incumbent workers in the rest of the economy. Workers find it harder to transition into such jobs with strong skill specificity. Consequently, as the labour supply adjusts only slowly, the relative wages of those activities increase more rapidly.19 With that in mind, this section analyses the speed at which local labour markets have adjusted to green transitions over the past two decades using individual-level data from the EU Labour Force Survey covering the Czech Republic, Estonia, Greece, Hungary, Latvia, Lithuania, Romania and the Slovak Republic, as well as Austria, Belgium, Denmark, Finland, Germany, Ireland, Italy, Portugal, Spain, Sweden and the United Kingdom.
This exercise estimates the relative elasticity of the labour supply for green occupations. Green occupations are identified using O*NET’s green job classification, which is based on the task content of each occupation. For non-green occupations, the green exposure measure is zero; for green occupations, it is based on that occupation’s share of the country’s total employment in 2000. Thus, nuclear plant operators are assumed to have greater exposure to green innovation in countries with larger nuclear power industries, and zero exposure in countries with no nuclear plants. This measure also assumes that the increase in demand for an occupation is proportionate to the size of that occupation within the economy, all other things being equal. Regression analysis relates the change in the occupation’s share of the country’s total employment since 2000 to a standardised measure of the occupation’s exposure to green innovation in that country, controlling for country fixed effects (the specificity of the local labour market) and time period fixed effects (general trends in the composition of occupations).
The results indicate that labour markets adjust fairly slowly in the face of a green transition. The employment shares of occupations that had greater exposure to green innovation in 2000 did not experience significant changes during the first decade of this century. That was true in the EBRD regions and advanced comparator economies alike (see Chart 3.16).
Stronger growth in relative employment for occupations with greater exposure to green innovation can be observed from 2015 onwards. By 2019, occupations where exposure to green innovation was 1 standard deviation greater saw extra growth in their employment shares of nearly 1 percentage point in the EBRD regions and 0.8 percentage points in advanced European economies.
There is very little difference between younger workers (age 37 and below) and older workers (age 38 and above) in terms of growth in the employment shares of occupations with greater exposure to green innovation (see Chart 3.17). This suggests that the requisite skills can be picked up through both formal education and on-the-job training.
Chart 3.16
Source: EU Labour Force Survey, O*NET and authors’ calculations.
Note: The estimates in this chart have been derived by regressing the change in an occupation’s percentage share of a country’s total employment relative to 2000 on a standardised measure of the occupation’s exposure to green innovation. Each regression controls for country and time period fixed effects. Observations are weighted by the level of employment in the baseline period. The 95 per cent confidence intervals shown are based on standard errors clustered at the country level. The EBRD economies used are the Czech Republic, Estonia, Greece, Hungary, Latvia, Lithuania, Romania and the Slovak Republic. The comparator countries are Austria, Belgium, Denmark, Finland, Germany, Ireland, Italy, Portugal, Spain, Sweden and the United Kingdom.
Chart 3.17
Source: EU Labour Force Survey, O*NET and authors’ calculations.
Note: The estimates in this chart have been derived by regressing the change in an occupation’s percentage share of a country’s total employment for young workers (age 37 and below) and older workers (age 38 and above) on a standardised measure of the occupation’s exposure to green innovation. Each regression controls for country and time period fixed effects. Observations are weighted by the level of employment in the baseline period. The 95 per cent confidence intervals shown are based on standard errors clustered at the country level. The EBRD economies used are the Czech Republic, Estonia, Greece, Hungary, Latvia, Lithuania, Romania and the Slovak Republic. The comparator countries are Austria, Belgium, Denmark, Finland, Germany, Ireland, Italy, Portugal, Spain, Sweden and the United Kingdom.
The role of task distance
If workers are able to move between geographical areas and industries with little friction and are assisted by retraining and upskilling programmes, this will support the green labour-market adjustment. However, many workers in polluting jobs or sectors will require targeted support to enable them to move into new jobs.20 Such mobility is easier when workers possess skills that are easily transferable from one job to another, with levels of switching tending to be higher where occupations require similar tasks.21 For instance, nuclear technicians and ship engineers have similarly high task scores when it comes to operational monitoring – watching gauges and dials to make sure that machinery is working properly. Similarly, biomedical engineers and lawyers both engage in complex problem solving.
If the task requirements of a green occupation are similar to those of a non-green occupation and the wages for that green occupation are at least as high, job reallocation should take place more smoothly relative to situations where the task requirements of green and brown jobs are far apart. Using O*NET data on the task content of every occupation, it is possible to calculate a measure of the distance between the tasks of a pair of occupations. Those distances can, in turn, be used to calculate a measure of the task distance between a given occupation and the rest of the economy as an average of all occupation task distances weighted by occupations’ employment shares in a given country.22 Occupations with a shorter distance to the rest of the economy (such as freight handlers) mostly require generic skills, rather than specialist skills. Aquatic life cultivators, in contrast, are characterised by a long distance to the rest of the economy.
In 2000, occupations classified as green had a slightly greater average distance to the rest of the economy relative to non-green occupations. The data on task distances can be incorporated into the analysis of changes in occupations’ employment shares by adding interaction terms that combine exposure to green innovation with dummy variables for each sextile of the task distance distribution.
This analysis suggests that the occupations that are most similar to the rest of the economy in terms of their task content have experienced significantly stronger growth in their employment shares relative to 2000 on account of their exposure to green innovation (see Chart 3.18). The same is also true of the occupations that are least similar to the rest of the economy task-wise, where retraining existing workers is harder but entry rates are probably high as a result of the higher wages associated with task specificity. For occupations with moderate levels of task distance, exposure to green innovation has only had a small – and often statistically insignificant – effect on employment shares.
These findings are consistent with the relative labour supply being less elastic where occupations require tasks that are sufficiently different (although not very different) from those used in the rest of the economy. As green occupations tend to require somewhat more specialist skills than the rest of the economy, this can help to explain the modest pace of labour markets’ adjustment to the roll-out of green technologies.
Chart 3.18
Source: EU Labour Force Survey, O*NET, Dworkin (2019) and authors’ calculations.
Note: The estimates in this chart have been derived by regressing the change in an occupation’s percentage share of a country’s total employment on a standardised measure of the occupation’s exposure to green innovation interacted with dummy variables for each sextile of the task distance distribution. Each regression controls for country and time period fixed effects. Observations are weighted by the level of employment in the baseline period. The 95 per cent confidence intervals shown are based on standard errors clustered at the country level. The sample comprises the Czech Republic, Estonia, Greece, Hungary, Latvia, Lithuania, Romania and the Slovak Republic, as well as Austria, Belgium, Denmark, Finland, Germany, Ireland, Italy, Portugal, Spain, Sweden and the United Kingdom.
Conclusion and policy recommendations
There are several lessons to be drawn from this analysis of the implications that the green transition has for the labour market.
First, it is crucial that the green transition is fair – providing decent and well-paid jobs for all workers regardless of their skill level or background – in order to maintain public support for achieving net zero greenhouse gas emissions in the economy. Second, there is high demand for green expertise, which tends to benefit highly skilled individuals in sectors with lower carbon emissions. Third, labour mobility between sectors and occupations remains low, despite the promise of higher pay, given the cost of retraining and upskilling. Fourth, new green technologies may be less labour-substituting than other technologies on average. Fifth, the green transition has the potential to progress faster than the ICT transition, insofar as workers of all ages have contributed to the reallocation of employment from non-green occupations to green occupations over the past two decades.
It is essential to acknowledge the labour-market challenges that could potentially result from the green transition and implement appropriate measures to support affected workers. Assistance for workers who experience the greatest impact from shifts in the job market can help to mitigate resistance to allocating public funding to environmentally friendly policies. Unemployment insurance and safety-net programmes can help in the short term, but their beneficiaries also need to be incentivised to invest in training and search for jobs.
Labour-market adjustment costs can be minimised by using the existing skill-sets of workers who are at the greatest risk of displacement in a local area, helping them to move into nearby jobs that require limited reskilling. This should be done with the explicit cooperation and guidance of local businesses. However, there will inevitably be adaptation challenges for specific workers and industries, who will need help in the form of reskilling and training programmes. The EU’s Just Transition Fund seeks to support such labour-market programmes as part of the green transition.
Evidence from multiple countries suggests that labour-market programmes can be effective in supporting the green transition, provided that they meet certain criteria.23 After screening candidates to assess their suitability for employment, these programmes need to provide training in sector-specific skills required by local employers (who often have input in that regard).24
Uptake of education and retraining often remains low in local labour markets that are hit by negative economic shocks, especially among more vulnerable workers in older age categories and lower income groups. For instance, the coal shock in the United States had almost zero impact on the uptake of education and training assistance – including programmes intended to help displaced workers retrain for new careers. In Germany, meanwhile, younger workers invested in ICT training when broadband arrived in their local labour markets, but older workers did not.25
One possible reason for that low uptake is a lack of coordination between policymakers and local businesses. Although such training is intended to provide workers with skills that potential employers will find attractive, employers often have limited involvement in those training programmes.26 Skills gaps vary across occupations and regions, and finding appropriate ways of addressing local skills mismatches requires ongoing cooperation between industry, trade unions, and technical and vocational schools in affected communities. More generally, the content of education and vocational training needs to be better aligned with the emerging demands of the green economy.
Those programmes also need to offer wrap-around services encompassing career readiness, counselling, job placements and post-placement job advancement, recognising that workers of all backgrounds and skill levels value decent and well-paid jobs that promise career progression. Examples of such programmes in the context of the green transition in the EBRD regions can be found in Box 3.3.
Moreover, further efforts are needed to incentivise green innovation in middle-income economies (including in the EBRD regions). With the exception of China, middle-income economies have not generally caught up with the economies at the green innovation frontier and remain less specialised in low-carbon technologies than high-income economies, despite the fact that most of the future increases in emissions are projected to take place in middle-income economies.27 The analysis in this chapter also shows that having green technologies account for a larger share of overall innovation has a positive effect on employment in local labour markets.
Because the green transition affects different geographical areas in different ways, a location-based strategy centred on local economic development and business support programmes will be vital in complementing national green transition policies, particularly when it comes to leveraging the potential of SMEs as primary sources of new employment growth.28 With that in mind, policy measures need to foster the development of green start-ups and small businesses – especially those adopting green technologies and those at the frontier of green innovation.
Box 3.1. The geography of carbon-intensive jobs in manufacturing
Transitioning to a greener economy is essential in order to address environmental challenges, but it can also have significant implications for the labour market. A key risk stems from job displacement in carbon-intensive areas. As the world shifts away from fossil fuels and towards renewable energy sources, there may be a decline in demand for jobs in traditional fossil fuel industries such as coal mining, oil drilling and the extraction of natural gas. Certain manufacturing sectors are particularly vulnerable to the green transition, as they have low value added relative to total emissions.29 Workers in these sectors could face job losses or reduced employment opportunities, especially if they lack the transferable skills required for a move to the emerging green energy sector.
Where carbon-intensive activities are concentrated in specific local labour markets, communities that are heavily reliant on high-carbon industries may experience more significant job losses. This could give rise to higher local unemployment rates and a loss of social cohesion if adequate regional development plans are not put in place.
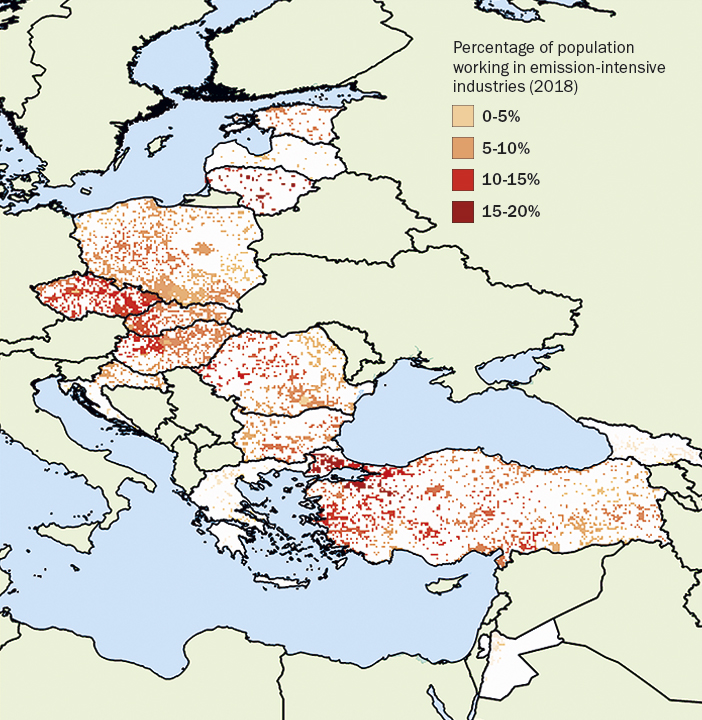
This box uses highly granular geographical data on emissions and administrative data from labour-force surveys to identify the localities with the highest concentrations of carbon-intensive manufacturing jobs in the EBRD regions. The data cover Bulgaria, Croatia, the Czech Republic, Estonia, Georgia, Greece, Hungary, Jordan, Kazakhstan, the Kyrgyz Republic, Latvia, Lithuania, Mongolia, Poland, Romania, the Slovak Republic, Türkiye and the West Bank and Gaza (with the choice of economies dictated by the availability of data).
EDGAR carbon dioxide emissions data for manufacturing facilities have been mapped to a grid with 11 km by 11 km cells. The population count for those grid cells has been calculated using the LandScan dataset. On the basis of those data, the analysis in this box focuses on the 11 km by 11 km grid cells that have manufacturing emissions in the top 40 per cent of the total distribution of such emissions.
Each of those locations is characterised by the percentage of the population that is employed in emission-intensive manufacturing sectors. Those percentage shares are approximated using data from the EU Labour Force Survey and six country-level labour-force surveys (see Chart 3.1.1). Manufacturing employment – data on which are only available at a broader, regional level – is assumed to be distributed uniformly across all high-emission locations within that region. Those estimates of manufacturing employment are, in turn, divided by population data for each 11 km by 11 km grid cell as obtained from LandScan. For instance, the city of Győr in the Nyugat-Dunántúl region of Hungary is one of the dots on the map: it is in the 10 per cent of locations with the highest levels of emissions in the EBRD regions, with an estimated 15 per cent of the population employed in emission-intensive industries.
Despite the gradual rise in green jobs’ share of total employment (as documented in this chapter), certain regions did in fact see a rise in the percentage of the population that was employed in carbon-intensive sectors between 2010 and 2018. For instance, provinces in north-western Hungary saw a 3 percentage point rise in the employment share of the manufacturing sector over that period, compared with 1 percentage point increases for construction, wholesale and retail trade, and public administration (the next biggest employers in those regions). A lack of diverse job opportunities, combined with high emission industries dominating the local labour market, can result in a large percentage of the local population continuing to work in carbon-intensive sectors.
Chart 3.1.1
The percentage of the population employed in carbon-intensive manufacturing industries varies across the EBRD regions
Box 3.2. Migration in response to weather shocks
Climate change could have a direct impact on economies in the EBRD regions in the form of reduced agricultural output, lower labour productivity and weaker investment, but it could also have an indirect impact through changes to migration patterns from and to other regions.30 Sub-Saharan Africa is one of the regions of the world that is expected to be worst affected by climate change, and significant numbers of migrants from sub-Saharan Africa are already coming to the EBRD regions each year (see Chart 3.2.1).
Climate change is having a significant impact on agriculture – particularly in rural economies in sub-Saharan Africa – while credit constraints and a lack of information are impeding adaptation in the face of that impact. In such circumstances, migration out of the affected areas could serve as an important adaptation strategy. In particular, weather shocks that harm agricultural yields could drive rural populations into urban agglomerations. At the same time, weather shocks could also discourage migration if they reduce the income that is available to cover expenses associated with relocation.
This box uses rich household-level panel survey data on weather shocks, migration decisions and socio-economic characteristics covering 38,000 unique households in rural regions of Ethiopia, Nigeria, Tanzania and Uganda between 2009 and 2019.31 Those survey data contain information on whether a household has experienced a weather shock, an economic shock (a sudden drop in output prices or a sudden increase in the price of agricultural inputs, for instance) or a political shock (such as local violence) in the past year and whether a member of the household has migrated.
The frequency of weather shocks varies widely from year to year and country to country. In Tanzania, almost 50 per cent of households experienced a weather shock such as drought or flooding in 2009, compared with only 14 per cent of households in 2019. In most countries, economic shocks are more frequent than weather shocks, while political shocks are less frequent. For example, in Nigeria, 30 per cent of households were hit by an economic shock in 2013, compared with 12 per cent that suffered a weather shock and 4 per cent that experienced a political shock. On average, 1 per cent of households per year report a member of the household migrating.
Regression analysis based on data for Ethiopia and Nigeria shows that a weather shock increases the probability of a household member migrating by 0.6 percentage points. The impact of an economic shock is even greater, with the likelihood of migration rising by an estimated 1.6 percentage points. The estimated effect of a political shock is similar to that of a weather shock, but is not statistically significant.
The results also indicate that weather shocks can predict migration in households with a male head, but not in households with a female head. This may reflect the fact that female-led households lack the resources needed to migrate. Among survey respondents, households with a female head had lower average levels of education and income, as well as smaller farms, and suffered more often from food insecurity. Female-led households were also more likely to be single-parent households, making it harder for part of the household to migrate. That relative lack of ability or willingness to respond to weather shocks by migrating has the potential to further exacerbate inequality between male-led and female-led households.
Climate change may exacerbate existing gender disparities in other ways, too. For instance, in response to an adverse economic shock caused by extreme weather, a household might decide to cut back on a girl’s education rather than a boy’s.
The 2015 survey data for Nigeria also include limited information on where migrants go when they migrate. According to those data, most Nigerian migrants stay within the same local government area. Between 2 and 4 per cent go abroad – and of those, half stay on the African continent, while around a quarter move to Europe.
In conclusion, weather shocks do incentivise people to migrate, with most remaining in the same region or country; however, economic shocks are still more important predictors of migration decisions for now. Better-off households are more likely to respond to weather shocks by migrating, as they have the means to do so, while female-led households (which tend to be poorer) are less likely to migrate in response to adverse weather.
Chart 3.2.1
Source: KNOMAD/World Bank Bilateral Remittance Matrix 2021 (December 2022) and authors’ calculations.
Chart 3.2.2
Source: World Bank (2019)
Note: This chart shows estimates derived from a linear probability model regressing the likelihood of a household member migrating in a given year on dummy variables for various shocks and various individual characteristics and country fixed effects. The sample comprises Ethiopia and Nigeria. The 95 per cent confidence intervals shown are based on robust standard errors.

Box 3.3. A just green transition in the SEMED region
An inclusive green transition is the only way to obtain a collective mandate for change, which requires political, economic and social buy-in from all parts of society. This box discusses the opportunities and requirements for a just green transition in the southern and eastern Mediterranean (SEMED).
Economies in the SEMED region enjoy an advantage when it comes to renewable energy, given their abundant natural resources. In order to take advantage of low-cost green energy, governments need to ramp up their investment in the infrastructure required by renewables, including battery storage, grid upgrades and expansions, water supply, bunkering and hydrogen transport. They also need to address workforce-related challenges by identifying skill shortages and investing in green skills, while retraining, upskilling and redeploying affected workers in brown sectors.
The energy pillar of Egypt’s recently launched Nexus of Water, Food and Energy (NWFE-EP) initiative envisages decommissioning 12 fossil fuel power plants with a total capacity of 5 GW (corresponding to 9 per cent of Egypt’s total installed capacity for fossil fuels). Those plants will be replaced with 10 GW of private solar and wind energy by 2028, which will also be used to produce green hydrogen. That initiative also incorporates an investment plan aimed at scaling up the capacity of the electricity grid and a plan to support workers affected by the decommissioning of the fossil fuel plants. At the same time, the country’s largest supplier of renewable energy, Infinity Energy, is rolling out work-based learning programmes with the support of the EBRD, aiming to provide young people with skills relevant to renewable energy, as well as introducing policies that help women to play a greater role in the company’s workforce.
Meanwhile, the Société Tunisienne de l’Electricité et du Gaz (STEG), Tunisia’s national electricity and gas company, has been using three channels to promote green skills for young people in the energy sector, supported by the EBRD. First, the introduction of national occupational skills standards for key energy-sector occupations (including jobs in renewable energy, data analytics and cybersecurity) will allow companies to base their recruitment on transparent criteria and help to ensure that the skills taught by educational establishments match those required by employers. Second, in cooperation with several local technical universities, STEG has launched an innovative training programme, combining internationally accredited master’s programmes for young engineers with on-the-job learning. And third, a comprehensive gender action plan has been adopted, focusing on promoting women’s access to technical and other STEM roles.
References
D. Acemoğlu and D.H. Autor (2011)
“Skills, tasks and technologies: Implications for employment and earnings”, in D. Card and O. Ashenfelter (eds.), Handbook of Labor Economics, Vol. 4, Part B, pp. 1043-1171, Elsevier.
S. Acevedo, M. Mrkaic, N. Novta, E. Pugacheva and P. Topalova (2020)
“The effects of weather shocks on economic activity: What are the channels of impact?”, Journal of Macroeconomics, Vol. 65, Article 103207.
R. Adão, M. Beraja and N. Pandalai-Nayar (2022)
“Fast and slow technological transitions”, mimeo.
S. Angelucci, F.J. Hurtado-Albir and A. Volpe (2018)
“Supporting global initiatives on climate change: The EPO’s ‘Y02-Y04S’ tagging scheme”, World Patent Information, Vol. 54, Supplement, pp. S85-S92.
D.H. Autor (2015)
“Why are there still so many jobs? The history and future of workplace automation”, Journal of Economic Perspectives, Vol. 29, No. 3, pp. 3-30.
D.H. Autor, C. Chin, A.M. Salomons and B. Seegmiller (2022)
“New Frontiers: The Origins and Content of New Work, 1940-2018”, NBER Working Paper No. 30389.
D. Card, J. Kluve and A. Weber (2018)
“What works? A meta analysis of recent active labor market program evaluations”, Journal of the European Economic Association, Vol. 16, No. 3, pp. 894-931.
E.C. Dierdorff, J.J. Norton, D.W. Drewes, C.M. Kroustalis, D. Rivkin and P. Lewis (2009)
“Greening of the world of work: Implications for O*NET-SOC and new and emerging occupations”, O*NET Resource Center. Available at: https://www.onetcenter.org/reports/Green.html (last accessed on 15 September 2023).
J.D. Dworkin (2019)
“Network-driven differences in mobility and optimal transitions among automatable jobs”, Royal Society Open Science, Vol. 6, No. 7, Article 182124.
EIB (2023)
EIB Investment Report 2022/23: Resilience and Renewal in Europe, European Investment Bank, Luxembourg.
C. Gathmann and U. Schönberg (2010)
“How general is human capital? A task-based approach”, Journal of Labor Economics, Vol. 28, No. 1, pp. 1-49.
G.W. Gu and G. Hale (2023)
“Climate risks and FDI”, Journal of International Economics, forthcoming.
G.H. Hanson (2023)
“Local Labor Market Impacts of the Energy Transition: Prospects and Policies”, NBER Working Paper No. 30871.
IEA (2022)
Skills Development and Inclusivity for Clean Energy Transitions, Paris. Available at: www.iea.org/reports/skills-development-and-inclusivity-for-clean-energy-transitions (last accessed on 15 September 2023).
ILO (2019)
Skills for a greener future: a global view, Geneva.
L.F. Katz, J. Roth, R. Hendra and K. Schaberg (2022)
“Why do sectoral employment programs work? Lessons from WorkAdvance”, Journal of Labor Economics, Vol. 40, No. S1, pp. S249-S291.
L. Kogan, D. Papanikolaou, L.D.W. Schmidt and B. Seegmiller (2021)
“Technology, vintage-specific human capital, and labor displacement: Evidence from linking patents with occupations”, NBER Working Paper No. 29552.
OECD (2023)
Job Creation and Local Economic Development 2023: Bridging the Great Green Divide, Paris. Available at: https://doi.org/10.1787/21db61c1-en (last accessed on 15 September 2023).
B. Probst, S. Touboul, M. Glachant and A. Dechezleprêtre (2021)
“Global trends in the invention and diffusion of climate change mitigation technologies”, Nature Energy, Vol. 6, No. 11, pp. 1077-1086.
N. Sofroniou and P. Anderson (2021)
“The green factor: Unpacking green job growth”, International Labour Review, Vol. 160, No. 1, pp. 21-41.
World Bank (2019)
“Living Standards Measurement Study – Integrated Surveys on Agriculture (LSMS-ISA)”, Washington, DC. Available at: www.worldbank.org/en/programs/lsms/initiatives/lsms-ISA (last accessed on 15 September 2023).
T.J. Zhu, A. Fritzler and J.A.K. Orlowski (2018)
“World Bank Group-LinkedIn data insights: jobs, skills and migration trends methodology and validation results”. Available at: https://policycommons.net/artifacts/1523930/world-bank-group-linkedin-data-insights/2209400 (last accessed on 15 September 2023).